The Guide to Choose Right Chart for Research Data
$0.00
Product Description
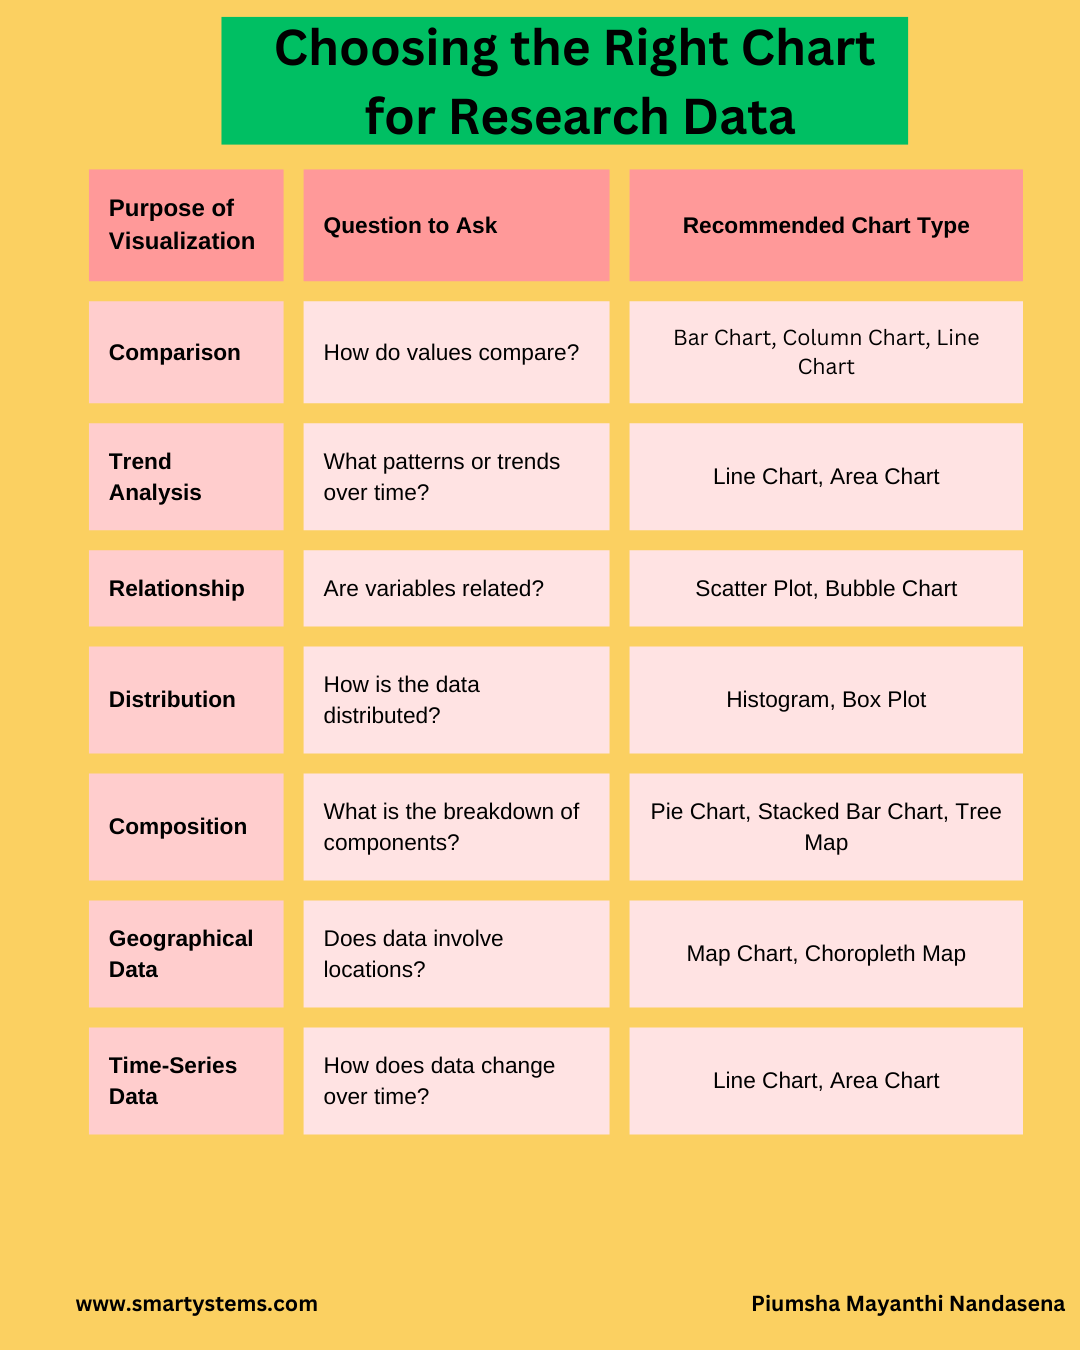
“Choosing the Right Chart for Research Data” is your ultimate guide to selecting the perfect visualization for your research needs. This concise and visually appealing infographic simplifies the decision-making process by matching your research goals with the most suitable chart type. Whether you’re analyzing trends, comparing values, or exploring relationships, this guide ensures you communicate your findings effectively. Designed for students, researchers, and professionals, it’s a must-have tool to make your data presentations impactful and easy to understand.
Key Features
- Clear Purpose Guidance: Helps you determine the exact visualization needed for your research goal.
- Chart Recommendations: Suggests the best chart type for comparisons, trends, distributions, and more.
- Easy-to-Follow Layout: Organized in a simple, three-column structure for quick reference.
- Versatile Usage: Suitable for academic, corporate, and personal data analysis tasks.
- Relatable for All Levels: Perfect for students, beginners, and seasoned researchers alike.
- Visually Engaging: Bright, appealing design for easy comprehension.
1 review for The Guide to Choose Right Chart for Research Data
Only logged in customers who have purchased this product may leave a review.


Pradeep Bhatt (verified owner) –
Keep doing good work